The Defense Department Budget rolls up the total spending by each military department—the Departments of the Air Force (which also includes the Space Force), the Navy (which also includes the Marine Corps), and the Army. Budget figures sometimes disagree, either because of rounding or because of different approaches to financial reporting. Variations appearing among the tables on the following pages are due to one or the other factor.
- DOD Budget Authority
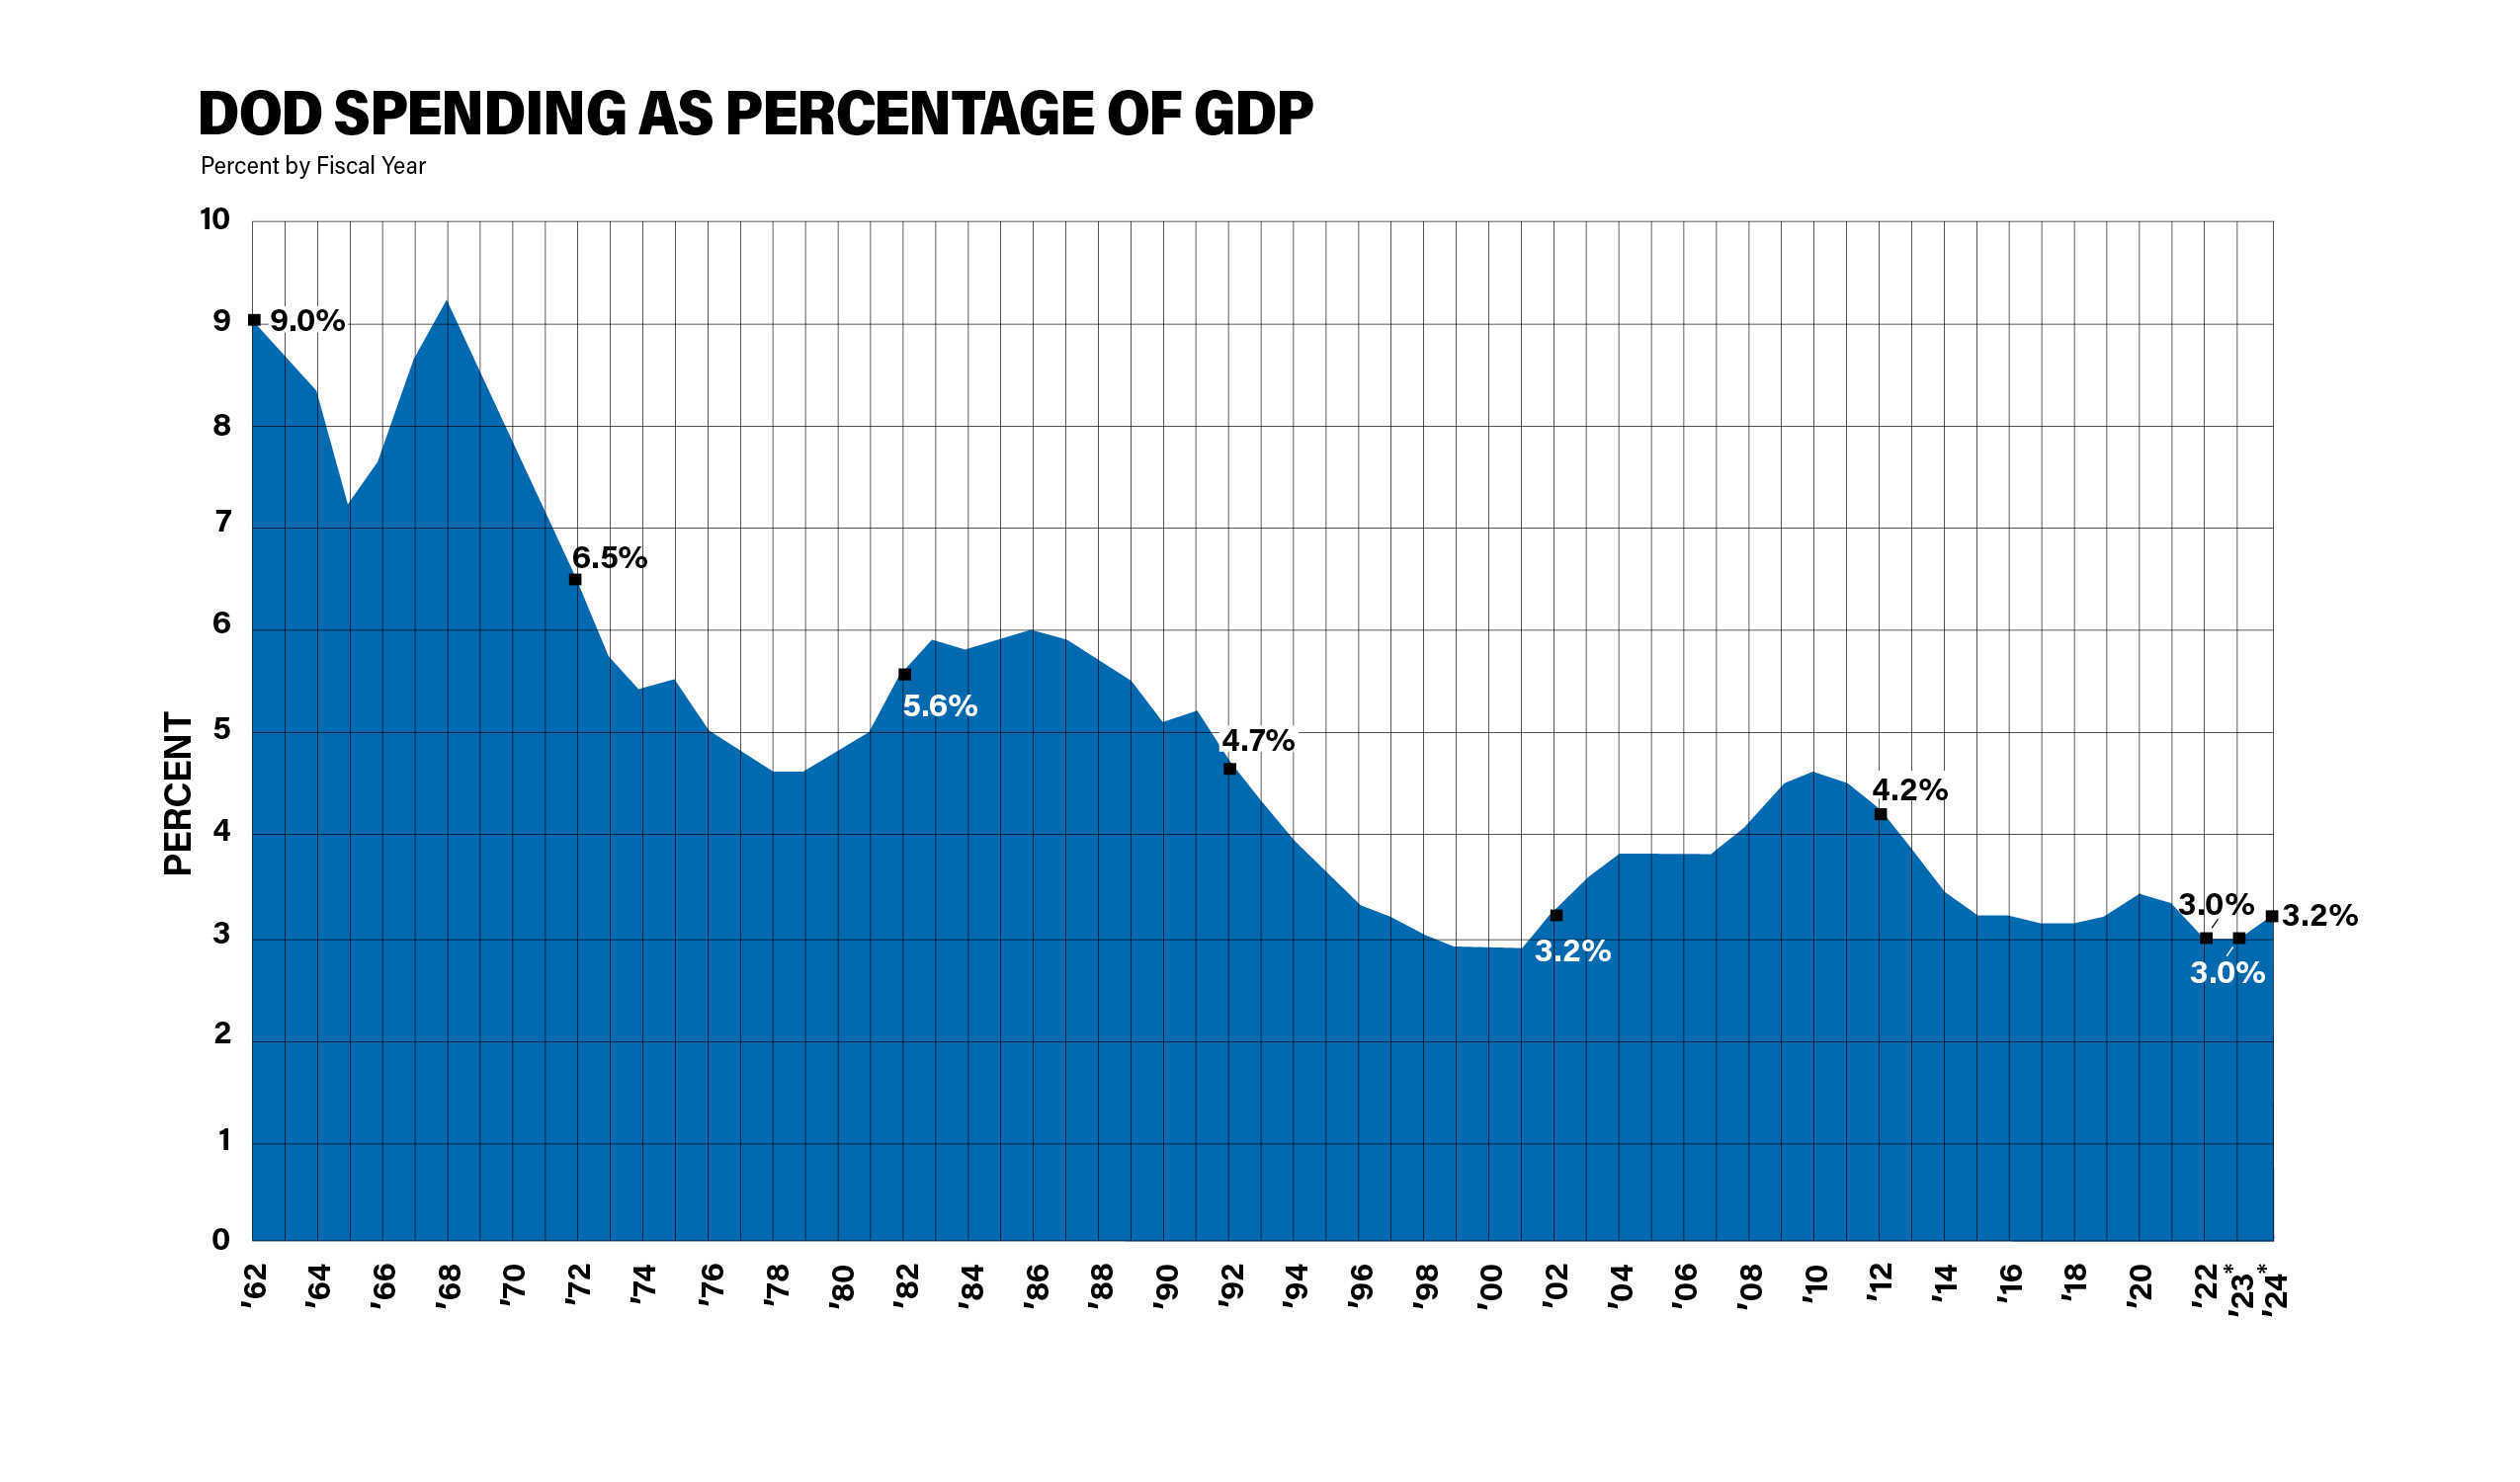
- DOD Spending as a Percentage of GDP
- Federal Spending as a Percentage of GDP
- Federal Spending as Percentage of Gross Domestic Product (GDP)
- DOD Budget By Service, Including Pass-Through
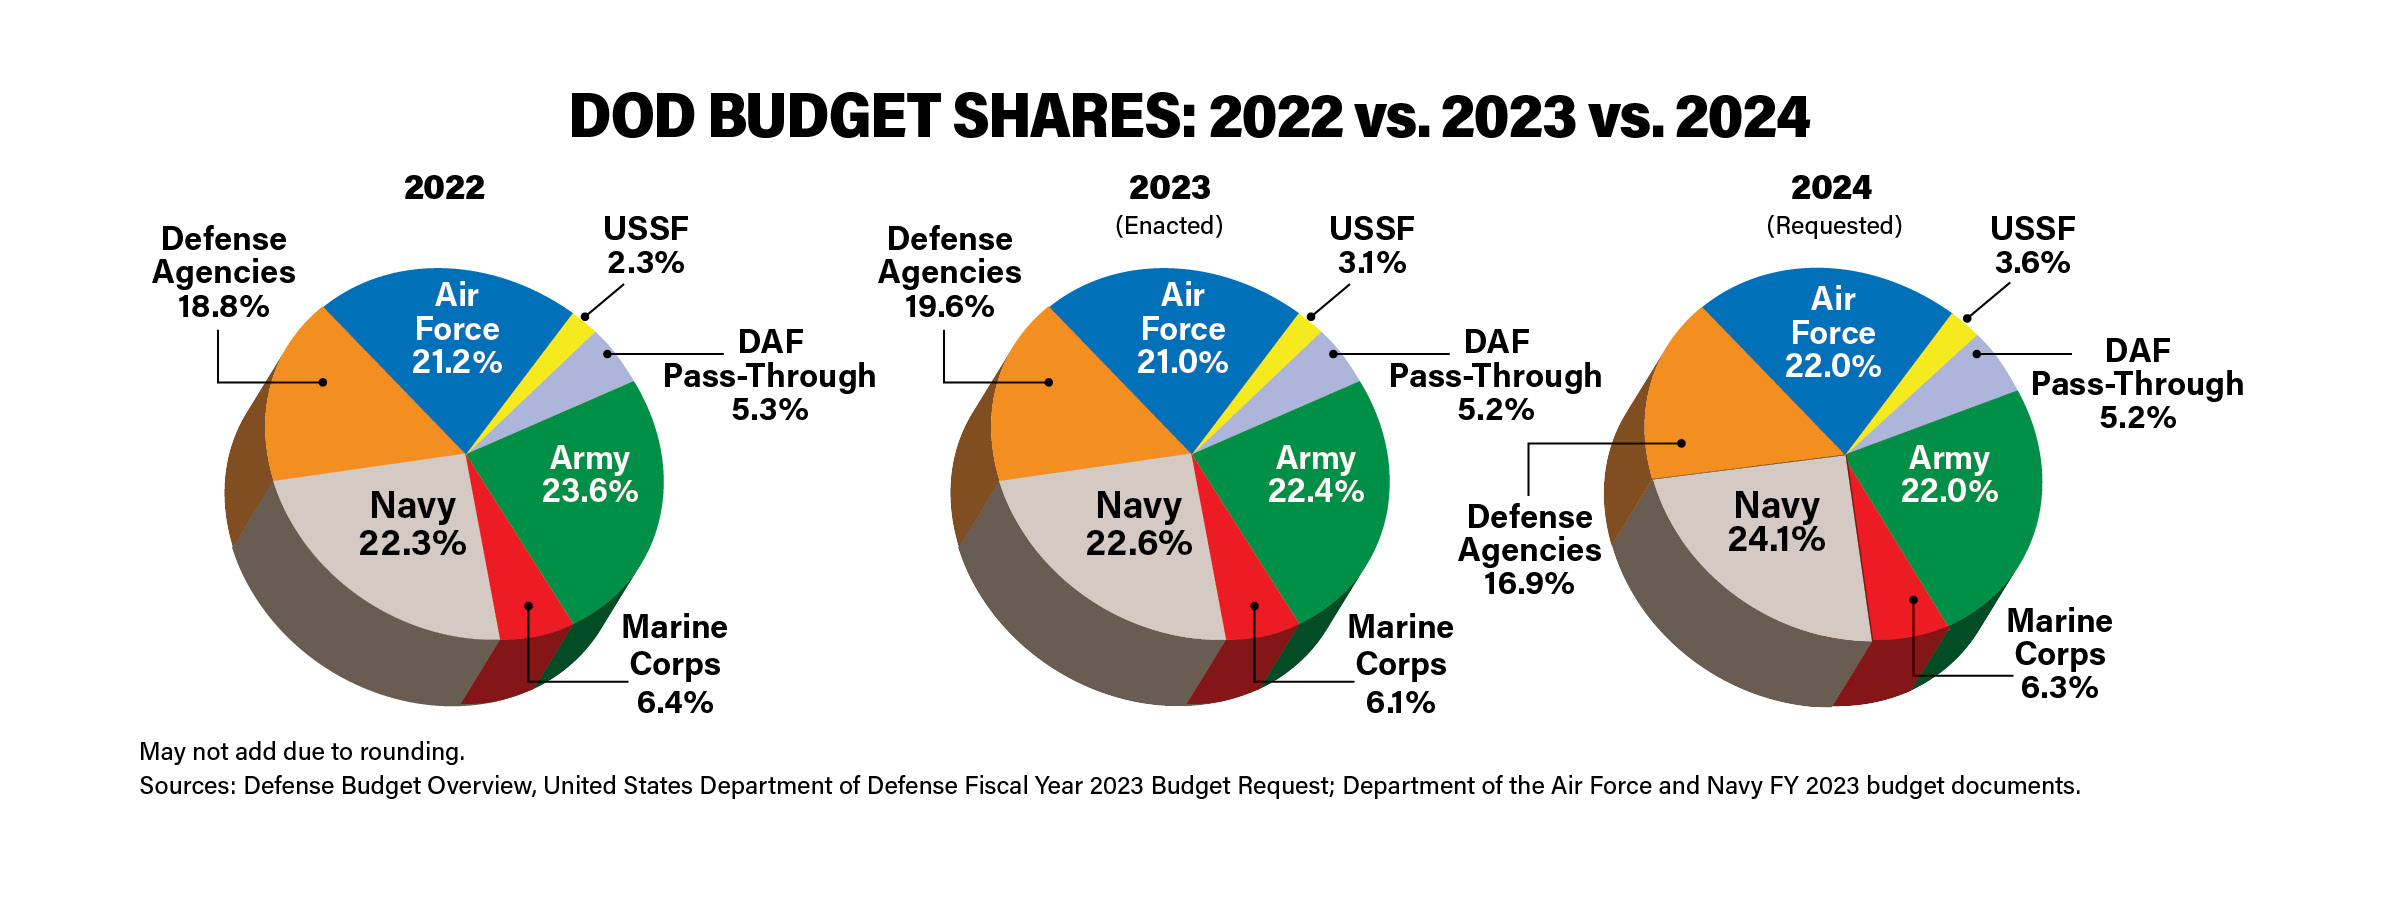
- DOD Budget Shares: 2021 vs. 2022 vs. 2023
- DOD Budget Shares By Military Department
- DOD Budget by Spending Category
- DAF Budget by Spending Category
- DAF Spending VS. Pass-Through
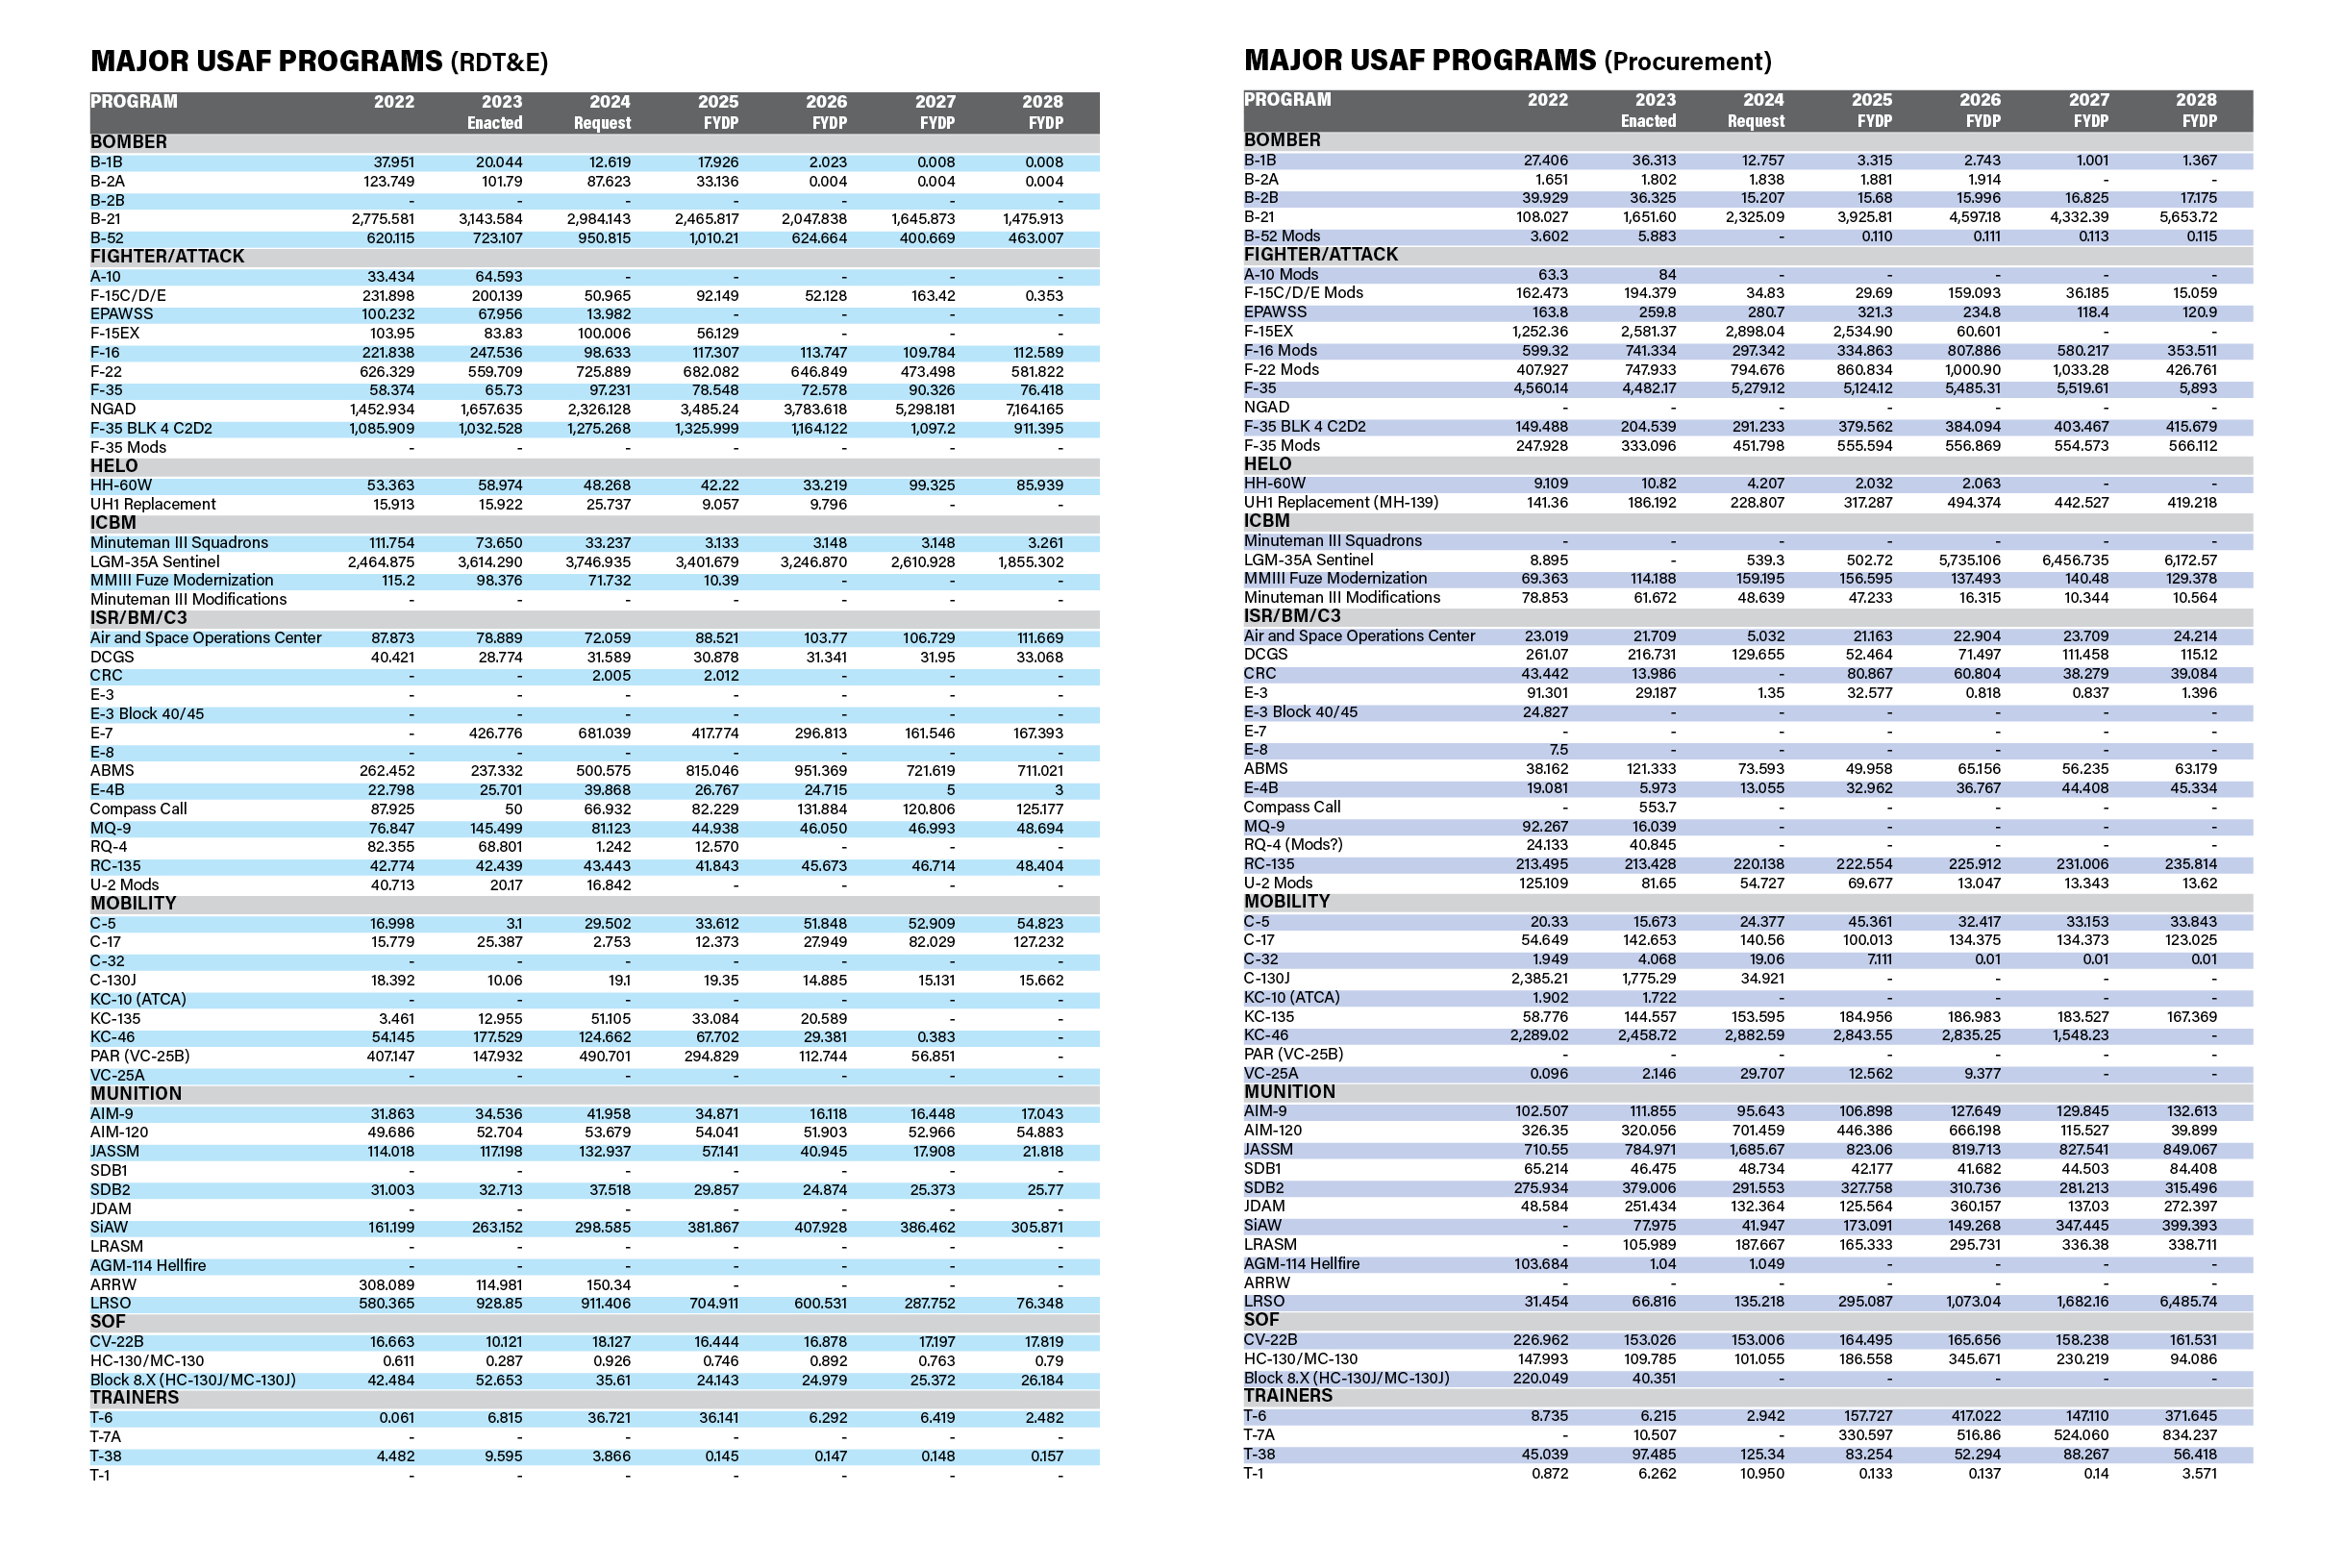
- Major USAF Programs
DOD BUDGET AUTHORITY
($ billions)
| 2018 | 2019 | 2020 | 2021 | 2022* | 2023* | 2024** | |
|---|---|---|---|---|---|---|---|
| Enacted* | Requested** | ||||||
| Base Budget | $600 | $616 | $633 | $703.7 | $742.2 | $816 | $842 |
| With Supplementals*** | $671 | $688 | $723 | $704.7 | $776.6 | $851.8 | $842 |
Source: Budget of the U.S. Government, Fiscal Year 2024
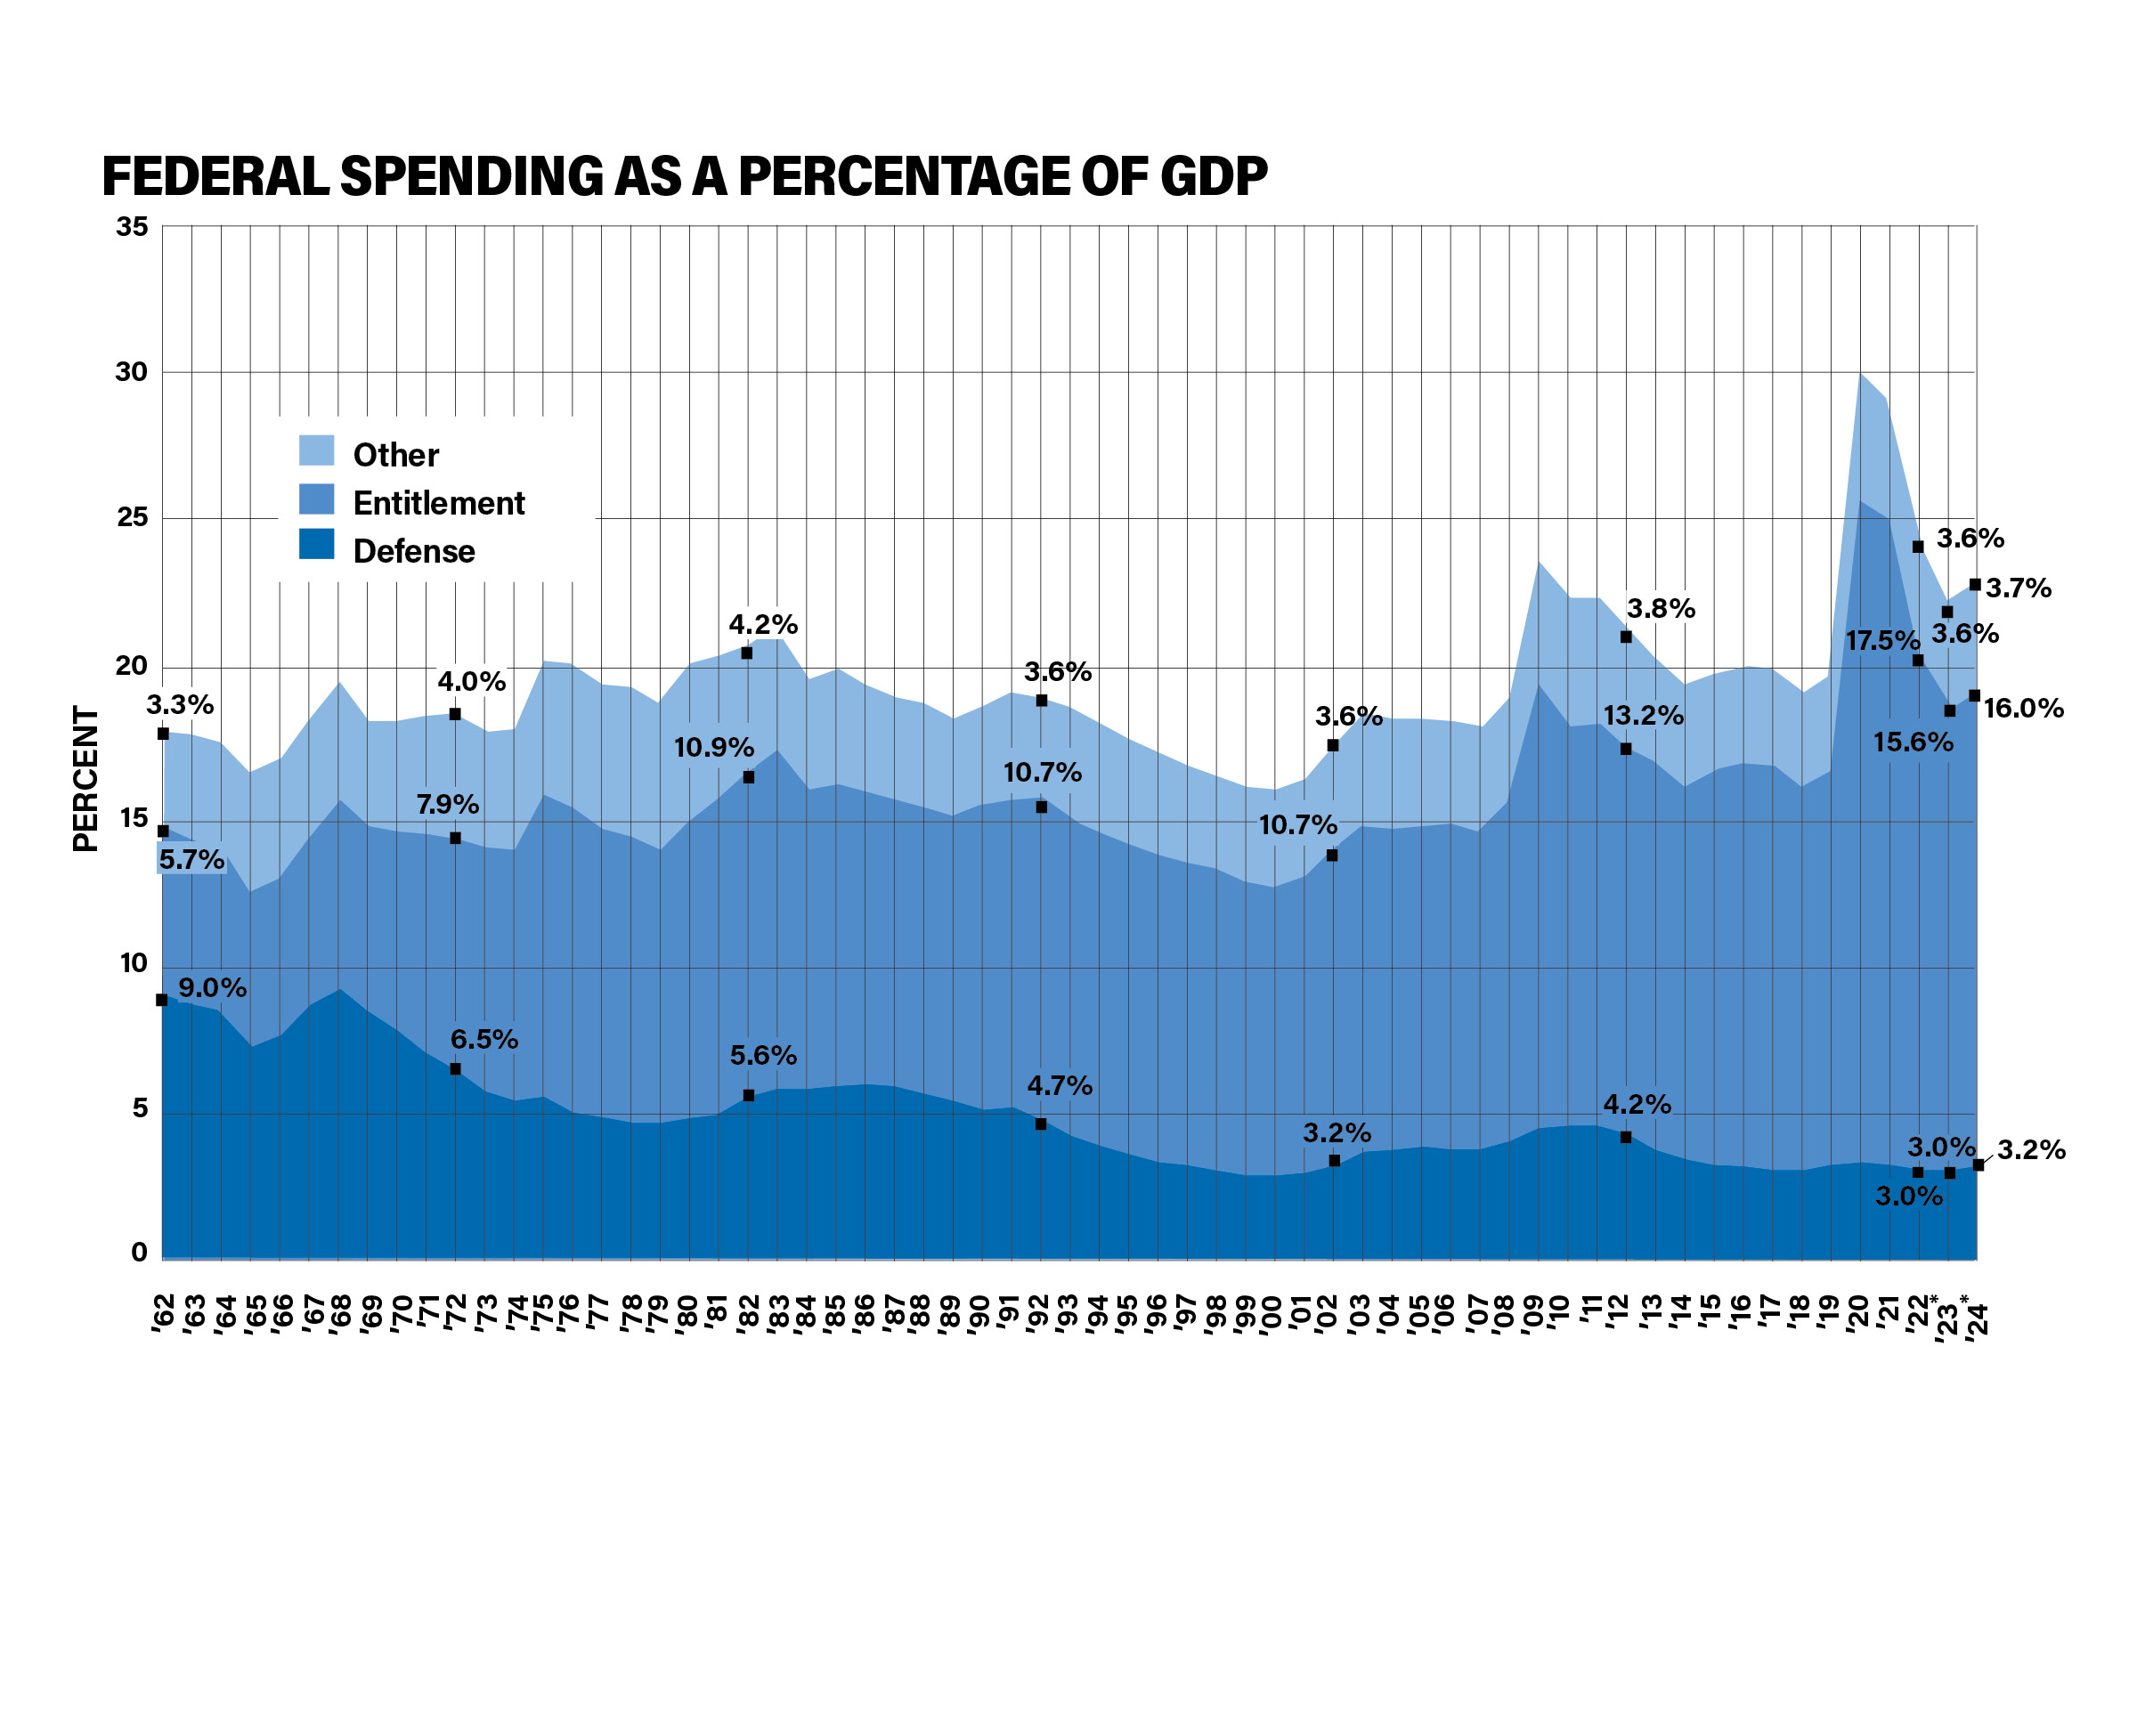
FEDERAL SPENDING as Percentage of Gross Domestic Product (GDP)
| Year | Defense | Entitlements | Other |
| 1962 | 9 | 5.7 | 3.3 |
| 1963 | 8.7 | 5.5 | 3.5 |
| 1964 | 8.3 | 5.6 | 3.6 |
| 1965 | 7.2 | 5.3 | 3.8 |
| 1966 | 7.6 | 5.3 | 4 |
| 1967 | 8.6 | 5.7 | 4.1 |
| 1968 | 9.2 | 6.4 | 4 |
| 1969 | 8.4 | 6.3 | 3.5 |
| 1970 | 7.8 | 6.7 | 3.7 |
| 1971 | 7.1 | 7.4 | 3.9 |
| 1972 | 6.5 | 7.9 | 4 |
| 1973 | 5.7 | 8.2 | 3.9 |
| 1974 | 5.4 | 8.5 | 3.9 |
| 1975 | 5.5 | 10.3 | 4.4 |
| 1976 | 5 | 10.3 | 4.8 |
| 1977 | 4.8 | 9.7 | 4.9 |
| 1978 | 4.6 | 9.7 | 5 |
| 1979 | 4.6 | 9.3 | 4.8 |
| 1980 | 4.8 | 10.1 | 5.1 |
| 1981 | 5 | 10.5 | 4.8 |
| 1982 | 5.6 | 10.9 | 4.2 |
| 1983 | 5.9 | 11.3 | 4.1 |
| 1984 | 5.8 | 10 | 3.8 |
| 1985 | 5.9 | 10.2 | 3.8 |
| 1986 | 6 | 9.9 | 3.6 |
| 1987 | 5.9 | 9.7 | 3.4 |
| 1988 | 5.7 | 9.6 | 3.4 |
| 1989 | 5.5 | 9.5 | 3.3 |
| 1990 | 5.1 | 10.3 | 3.4 |
| 1991 | 5.2 | 10.4 | 3.5 |
| 1992 | 4.7 | 10.7 | 3.6 |
| 1993 | 4.3 | 10.5 | 3.7 |
| 1994 | 3.9 | 10.5 | 3.6 |
| 1995 | 3.6 | 10.4 | 3.6 |
| 1996 | 3.3 | 10.4 | 3.4 |
| 1997 | 3.2 | 10.2 | 3.3 |
| 1998 | 3 | 10.2 | 3.2 |
| 1999 | 2.9 | 9.9 | 3.1 |
| 2000 | 2.9 | 9.8 | 3.2 |
| 2001 | 2.9 | 10 | 3.3 |
| 2002 | 3.2 | 10.7 | 3.6 |
| 2003 | 3.6 | 11 | 3.7 |
| 2004 | 3.8 | 10.8 | 3.7 |
| 2005 | 3.8 | 10.8 | 3.7 |
| 2006 | 3.8 | 10.9 | 3.6 |
| 2007 | 3.8 | 10.7 | 3.5 |
| 2008 | 4.1 | 11.4 | 3.5 |
| 2009 | 4.5 | 15.1 | 4 |
| 2010 | 4.6 | 13.4 | 4.4 |
| 2011 | 4.5 | 13.7 | 4.2 |
| 2012 | 4.2 | 13.2 | 3.8 |
| 2013 | 3.8 | 12.7 | 3.5 |
| 2014 | 3.4 | 12.6 | 3.4 |
| 2015 | 3.2 | 13.3 | 3.3 |
| 2016 | 3.2 | 13.6 | 3.2 |
| 2017 | 3.1 | 13.6 | 3.2 |
| 2018 | 3.1 | 12.9 | 3.1 |
| 2019 | 3.2 | 13.4 | 3.1 |
| 2020 | 3.4 | 22.3 | 4.3 |
| 2021 | 3.3 | 21.9 | 3.9 |
| 2022 | 3 | 17.5 | 3.6 |
| 2023 estimate | 3 | 15.6 | 3.6 |
| 2024 estimate | 3.2 | 16 | 3.7 |
DOD Budget By SERVICE, INCLUDING PASS-THROUGH
($ in millions)
| Enacted | Requested | |||||
| 2022 | % | 2023 | % | 2024 | % | |
| Department of the Air Force | $223,553 | 28.8 | $249,175 | 29.3 | $259,240 | 30.8 |
| USAF** | 164.7 | 21.2 | 179.7 | 21 | 185.1 | 22 |
| USSF** | 17.8 | 2.3 | 26.1 | 3.1 | 30 | 3.6 |
| Pass-Through** | 41.1 | 5.3 | 43.9 | 5.2 | 44.2 | 5.2 |
| Army | 183,512 | 23.6 | 190,805 | 22.4 | 185,337 | 22 |
| Department of the Navy | 223,231 | 28.7 | 244,508 | 28.7 | 255,753 | 30.4 |
| Navy | 173,268 | 22.3 | 192,845 | 22.6 | 202,553 | 24.1 |
| Marine Corps | 49,917 | 6.4 | 51,860 | 6.1 | 53,219 | 6.3 |
| Defense Agencies | 146,336 | 18.8 | 167,319 | 19.6 | 141,670 | 16.8 |
| Total | 776,632 | 851,807 | 842,000 |
**Limited details available
Sources: Defense Budget Overview, United States Department of Defense Fiscal Year 2023 Budget Request; Department of the Air Force and Department of the Navy FY 2023 budget
documents.
DOD Budget Shares By Military Department
($ millions)
| Enacted | Requested | |||||||
| 2017 | 2018 | 2019 | 2020 | 2021 | 2022 | 2023 | 2024 | |
| DAF* | $171,457 | $190,359 | $196,066 | $206,691 | $204,574 | $223,553 | $249,175 | $259,240 |
| % | 28.1 | 28.3 | 28.3 | 29 | 29 | 28.8 | 29.3 | 30.8 |
| Army | $159,018 | $178,260 | $181,166 | $184,195 | $174,040 | $183,512 | $190,805 | 185,337 |
| % | 26.1 | 26.5 | 26.1 | 26.2 | 24.7 | 23.6 | 22.4 | 22 |
| Navy/Marine Corps | $174,058 | $190,489 | $197,778 | $209,383 | $206,936 | $223,231 | $244,508 | 255,753 |
| % | 28.57 | 28.31 | 28.54 | 29.8 | 29.4 | 28.7 | 28.7 | 30.4 |
| Defense Agencies | $104,754 | $113,853 | $117,991 | $122,955 | $119,184 | $146,336 | $167,319 | 141,670 |
| % | 17.2 | 16.9 | 17 | 17.5 | 16.9 | 18.8 | 19.6 | 16.8 |
| Total | $609,287 | $672,960 | $693,001 | $723,224 | $704,734 | $776,632 | $851,807 | $842,000 |
Sources: Defense Budget Overview, United States Department of Defense Fiscal Year 2023 Budget Request; Department of the Air Force and Department of the Navy FY 2023 budget documents.
DOD Budget by Spending Category
(Base budget not including war funding; current $ billions)
| Enacted | Requested | |||||
| 2019 | 2020 | 2021 | 2022 | 2023 | 2024 | |
| Military Personnel | $144.70 | $149.90 | $162.80 | $166.80 | $172.20 | $178.80 |
| O&M | 231.4 | 237.2 | 283.6 | 294.5 | 319.9 | 329.7 |
| Procurement | 133.8 | 129.1 | 140.7 | 145.1 | 163.7 | 170 |
| RDT&E | 94.1 | 103.6 | 105.9 | 118.5 | 139.4 | 145 |
| Military Construction | 8.8 | 9.9 | 7.1 | 13.4 | 16.6 | 14.7 |
| Family Housing | 1.6 | 1.5 | 1.4 | 1.5 | 2.3 | 1.9 |
| Revolving Funds | 1.9 | 2.3 | 2.1 | 2.3 | 1.7 | 1.7 |
| Total | $687.80 | $633.30 | $703.70 | $742.20 | $816.00 | $842.00 |

DAF Budget by Spending Category
(Base budget in $ billions; does not include war or emergency funding)
| Enacted | Requested | |||||
| 2019 | 2020 | 2021 | 2022 | 2023 | 2024 | |
| Military Personnel | $37.40 | $39.40 | $42.80 | $44.40 | $46.10 | $48.50 |
| O&M | 51.2 | 53.4 | 65.5 | 69.9 | 75.9 | 79.5 |
| Procurement | 43.2 | 43.3 | 47.8 | 49.5 | 58.2 | 61.7 |
| RDT&E | 40.6 | 45.3 | 46.2 | 52.8 | 61.3 | 65.8 |
| Military Construction | 2 | 2.4 | 1.3 | 3.5 | 4.6 | 3.2 |
| Family Housing | 0.4 | 0.4 | 0.4 | 0.4 | 0.6 | 0.6 |
| Revolving and Management | 0.1 | 0.2 | 0.4 | 0.5 | 0.1 | 0.1 |
| Total | $174.80 | $184.50 | $204.50 | $221.00 | $246.80 | $259.20 |
| Enacted | Requested | |||||
| % Change | 2019 | 2020 | 2021 | 2022 | 2023 | 2024 |
| Military Personnel | 7.80% | 5.30% | 8.60% | 3.70% | 3.80% | 5.20% |
| O&M | 2.1 | 4.3 | 22.7 | 6.7 | 8.6 | 4.7 |
| Procurement | 3.5 | 0.2 | 10.4 | 3.6 | 17.6 | 6 |
| RDT&E | 40.1 | 11.6 | 2 | 14.3 | 16.1 | 7.3 |
| Military Construction | -10.6 | 20 | 45.8 | 169.2 | 31.4 | -30.4 |
| Family Housing | 17.9 | 0 | 0 | 0 | 50 | 0 |
| Revolving and Management | 16.4 | 100 | 100 | 25 | -80 | 0 |
| Total | 1.80% | 5.50% | 10.80% | 8.10% | 11.70% | 5.00% |
DAF Spending vs. Pass-Through
(Total Obligation Authority; $ in billions)
| Enacted* | Enacted* | Enacted* | Enacted | Requested | ||||
| 2017 | 2018 | 2019 | 2020 | 2021 | 2022 | 2023 | 2024 | |
| DAF | $136.60 | $151.50 | $156.80 | $168.10 | $168.20 | $180.80 | $205.80 | $215.10 |
| Pass-Through | 34.3 | 37.2 | 37.8 | 39 | 37.3 | 41.4 | 43.9 | 44.2 |
| Total | 170.9 | 188.7 | 194.6 | 207.1 | 205.5 | 222.3 | 249.7 | 259.3 |
| Pass-Through % | 20.10% | 19.70% | 19.40% | 18.80% | 18.20% | 18.60% | 17.60% | 17.00% |